
By following children’s movement patterns across a full school year, we gained valuable insight into how daily routines and environments shape activity. The next step was turning that data into meaningful learning for everyone in the school community. From governors and senior leaders to support staff and pupils, the findings were translated to help them understand the patterns, inform decisions, and inspire thoughtful change.
 The Research Study
We wanted to understand how children’s physical activity levels change throughout a school year, including a comparison of weekdays to weekends. Instead of just looking at one point in time, we followed the same children across three seasons to see patterns and trends.
 Who was studied
• 249 children aged 7-8 years (year 4) from 7 primary schools in East Lancashire
• About half were girls (51.4%)
• Children wore special activity monitors on their wrists for a week at three different times during the 2023-24 school year
When they were measured
📅 Autumn 2023 (November-December)
❄️ Winter 2024 (February-March)
☀️ Summer 2024 (June-July)
Key Findings
Overall activity levels were encouraging
• All children were quite active – even the “least active” group met healthy activity levels
• Most children got at least 10-15 minutes of activity at running level-intensity each day
Weekday activity increased over the school year
• Children’s physical activity significantly increased from autumn to summer on weekdays
• The biggest increases happened during their most active moments of each day
• Boys were generally more active than girls throughout the year
Weekend activity stayed more stable
• Weekend activity levels showed smaller, less consistent changes
• Overall weekend activity was lower than weekday activity at all times of year
Important insights
• Spring/summer months showed a boost in children’s activity levels
• Different children have different activity patterns – one size doesn’t fit all
Three groups of children emerged
The research found children naturally fell into three activity groups:
1. Most Active Group (about 1/3 of children)
• Stayed consistently active throughout the year
• Maintained high activity levels in all seasons
2. Moderately Active Group (about 1/3 of children)
• Showed moderate increases in activity over time
3. Least Active Group (about 1/3 of children)
• Started with lower activity but showed the biggest improvements by summer
• Even children who started as the least active group showed significant improvements over the school year, suggesting that all children can benefit from supportive environments that promote physical activity.
Why These Patterns Might Occur
School Structure and Opportunities
• Consistent daily routines on weekdays provide regular activity opportunities
• PE lessons, break times, and after-school activities create structured movement time
• Active travel to school (walking, cycling) is more common on weekdays
• Schools may increase outdoor activities and sports due to seasonal factors
*The schools involved have all participated in the Ready Set Move Active Schools Middle Leaders Programme, which focuses on embedding a new culture of movement within schools. They have introduced changes such as adopting more active uniforms, reimagining spaces to encourage active play, and incorporating movement into classrooms through active learning. As the Middle Leaders worked to embed and sustain these changes between Autumn 2023 and Summer 2024, it’s encouraging to see signs that these efforts may have contributed to an increase in children’s activity levels.
Individual Development Patterns
• Least active children may gain confidence and skills over the school year
• Social connections and friendships formed through school activities encourage participation
• Motor skills development throughout the year makes activities more enjoyable
• Some children may discover new activities or interests as the year progresses
Translating the data 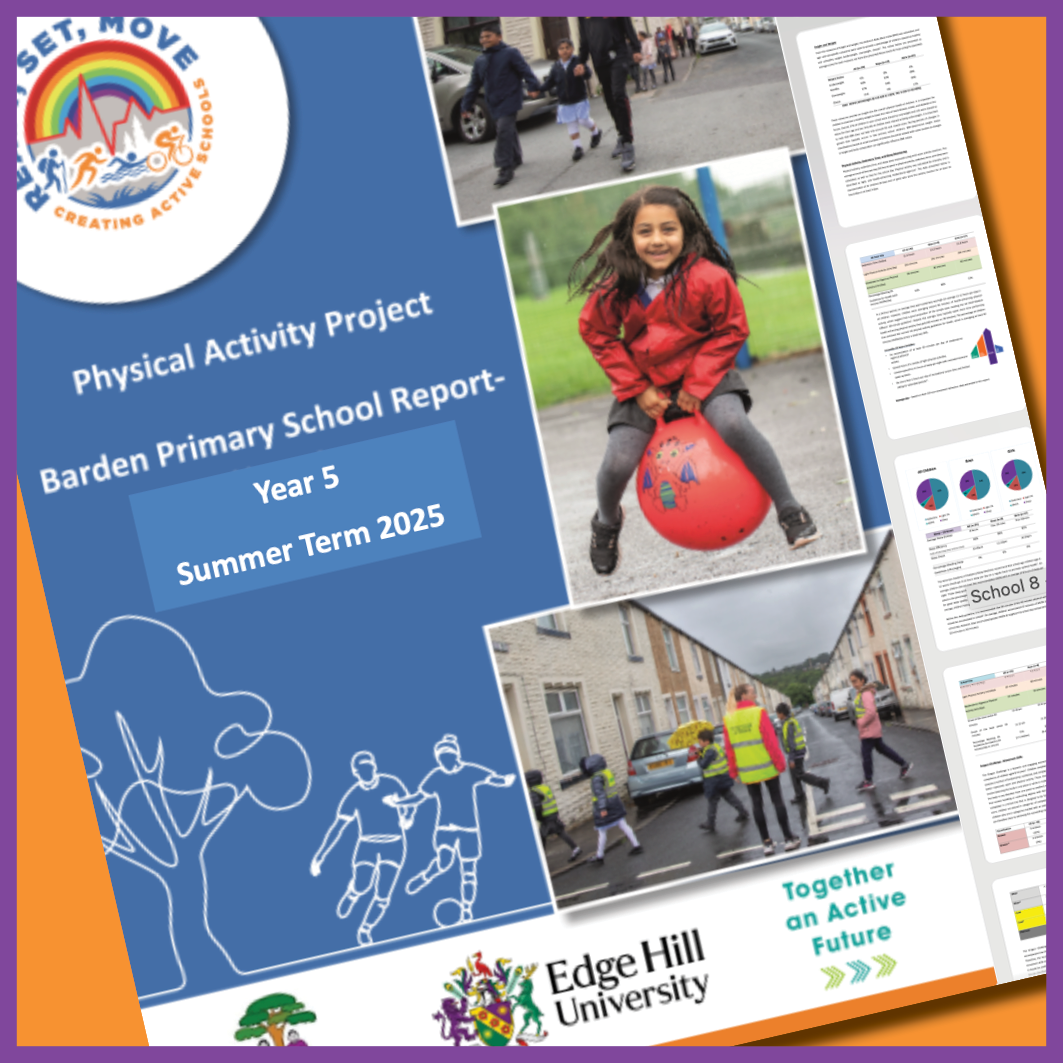
Understanding the data was only the first step – what really matters is how we translate those insights into action. To make the findings meaningful and usable for everyone in the school system, we created a range of tailored outputs designed to speak to different audiences:
- Academic reports summarised the evidence for senior leaders and governors, helping them see how school structures and routines can influence physical activity throughout the year.
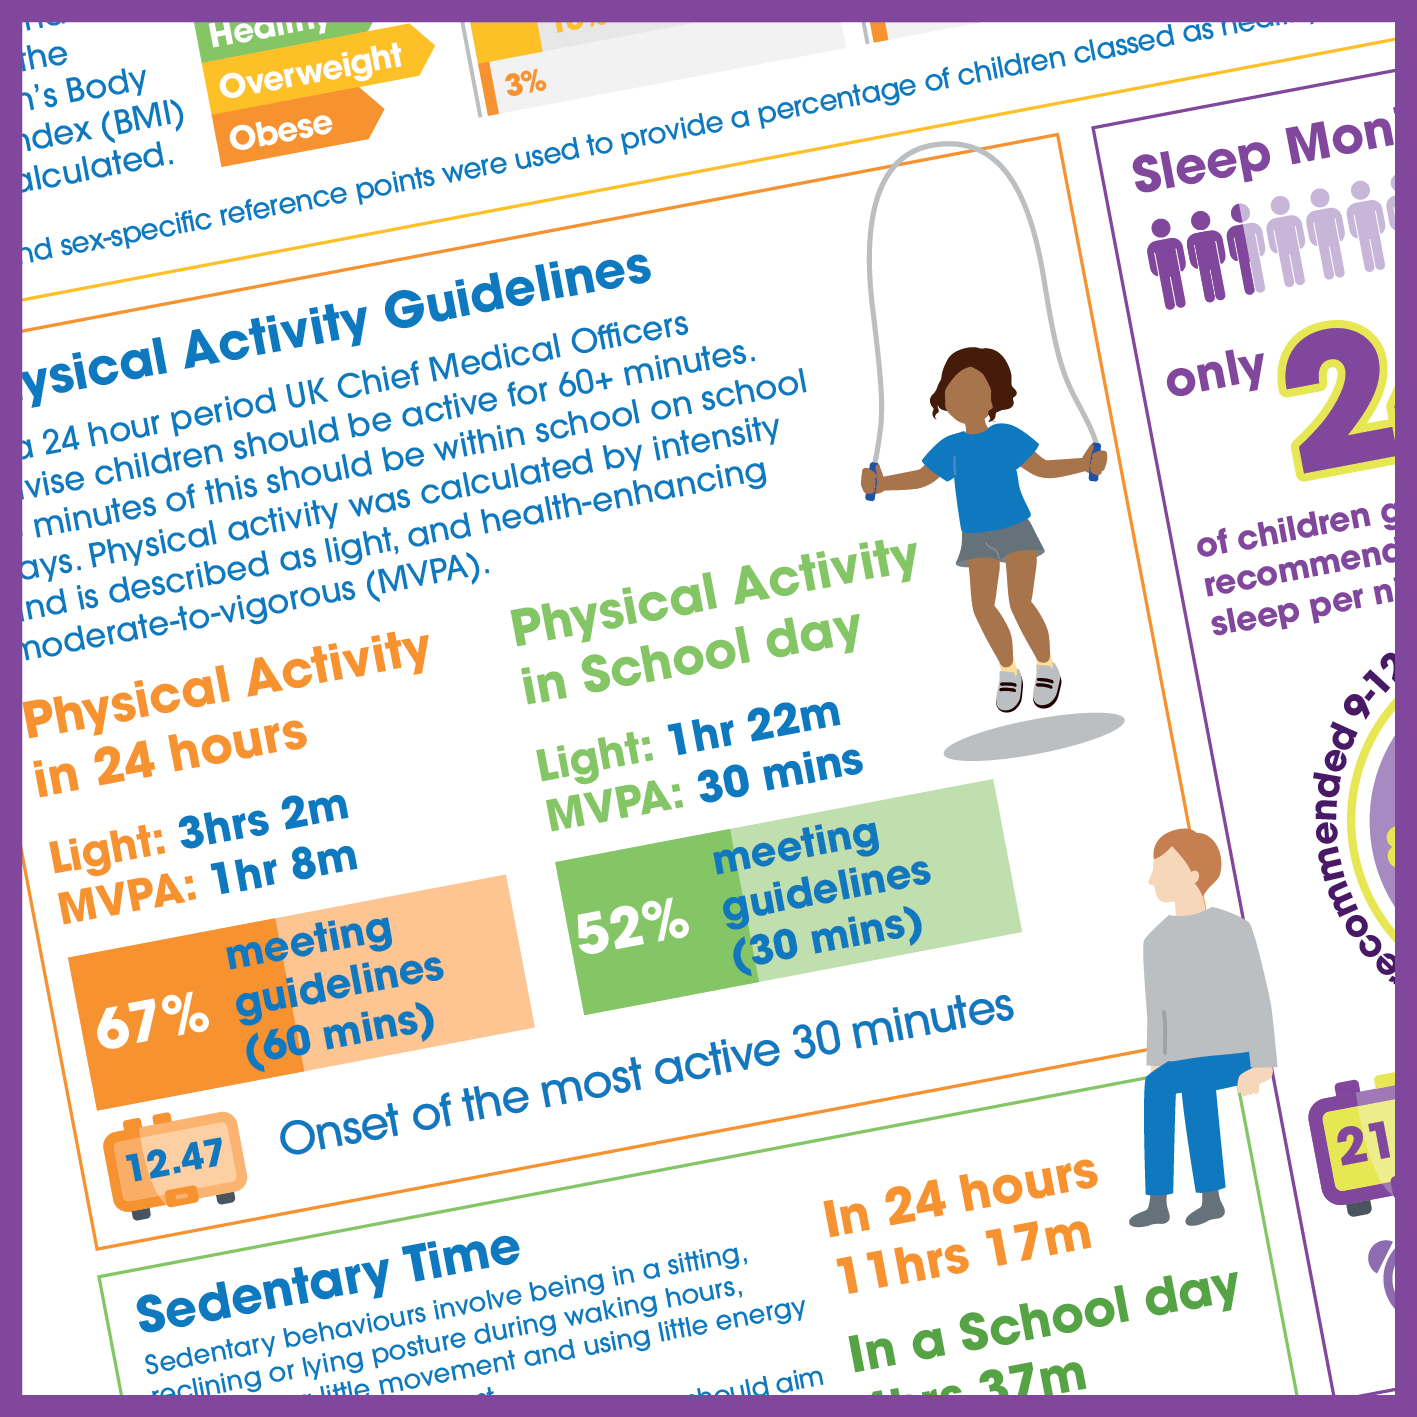
- Infographics and visual summaries made the data accessible to teachers, showing clear, practical ways to build movement into the school day. See an example of the infographics here.
- Pupil voice videos brought the numbers to life, sharing children’s reflections on why movement is important – helping other children and parents understand the experiences behind the data.
By translating findings into clear stories and visuals, schools can better see what’s working, what might need to change, and where new opportunities lie. The learning is already helping shape how middle leaders plan, reflect and make decisions, helping to bridge the gap and turn evidence into everyday action.
Using the data to inform decisions
The schools were supported by a research assistant and our Active Schools Lead through a series of one-to-one workshops and meetings. These sessions helped them analyse and interpret their data to plan and design further changes and physical activity opportunities within their schools.
All Saints used the data to identify points in the school day when children were least active. From this, they were able to adjust their timetable so that more active lessons (such as Design & Technology, Science, and Art) were interspersed with the more sedentary ones (such as RE, Maths, and English), helping to break up prolonged periods of sitting. Read their story here.
Broadway used the data to identify specific groups of pupils who were still struggling to engage in physical activity and movement opportunities. Targeted provision and interventions were then designed with these young people to help them participate, engage, and move more. Read their story here.